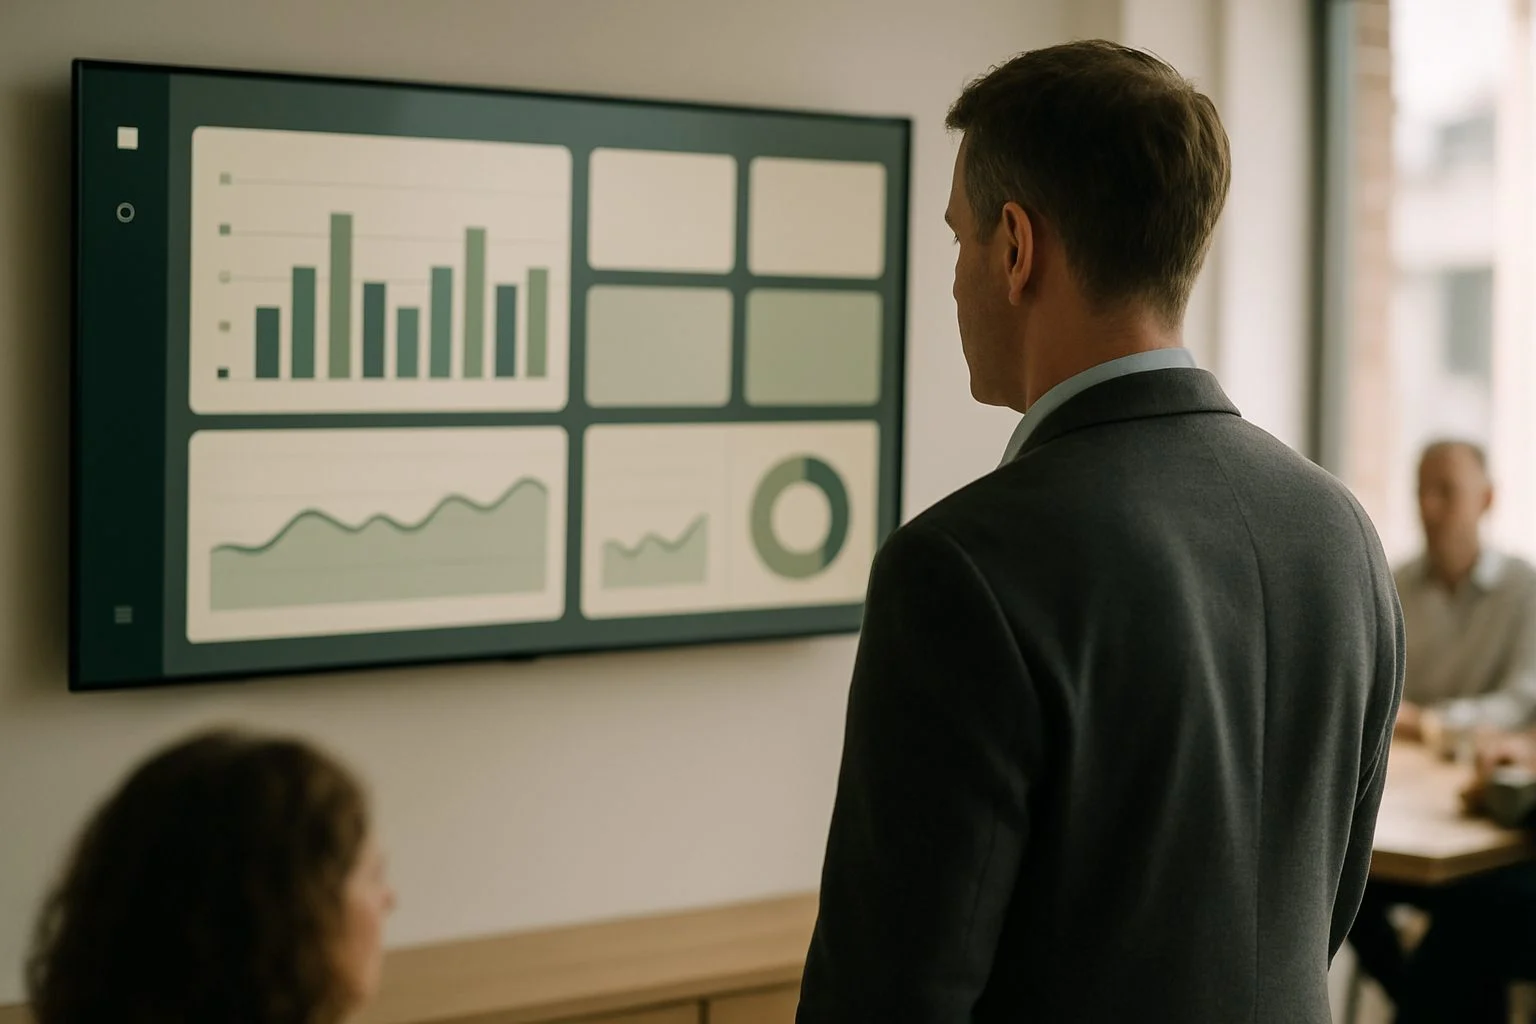
Have dashboards & reports built
Do you want a dashboard built that runs on live numbers instead of copy-paste work? We build dashboards and reports on one reliable data layer - so you steer on what is happening right now.
The trade-off
When a dashboard or report is the right choice
Understand first, then build - we work alongside your people.
Sound familiar: the monthly report takes days, every time. Numbers come from the ERP, the CRM and a handful of spreadsheets, someone cuts and pastes it all together, and by the time the overview is ready it is already out of date. Every department presents its own version of the same figure - and the meeting is about whose number is right, not about what to do with it.
That is rarely a reporting challenge; it is a data challenge.
The signals
- The monthly report takes days, every time
- Numbers come from the ERP, the CRM and a handful of spreadsheets
- Every department presents its own version of the same figure
Within our work on data & integrations we therefore fix the underlying data flows first. After that, the dashboard itself is the easy part: simple at the front, complexity solved behind the scenes.
Start here - Integration scan
A clear view of your data flows in one week - and where they pinch.
We map your systems, integrations and manual in-between steps. You get a clear overview with risks and a concrete plan - not a report for the drawer.
1 week
fixed timeline
1 map
of all your data flows
1 plan
prioritised by impact
Have a dashboard built that shows the real work
For the factories on the Manufacturing in your pocket platform we built real-time dashboards showing production performance (OEE and TEEP) at three levels: factory, line and station. When a value drops below a threshold, an alert follows immediately - adjusting happens while it still matters, not in the review afterwards. For Metics we replaced dozens of Excel sheets with a single planning platform: balance, forecasts and scenarios in one place, traceable and without manual formulas.
The foundation is always the same: one data layer where your sources come together. We connect systems through API integrations; historical data from legacy systems or spreadsheets comes in through a data migration. Calculations and definitions live in that data layer - one version of the truth - so every figure can be traced back to its source and a report never again depends on who maintains the spreadsheet.
And sometimes the honest conclusion is that a standard BI package on that data layer is enough. Fine: the goal is that you can steer, not that there is custom software in place. We build custom where it makes the difference - when the dashboard is part of the daily work process, when business logic lives in the numbers, or when users need to do more than look.
- Real-time dashboards on one central data layer
- Management reports that compile themselves
- KPI monitoring with thresholds and automatic alerts
- Integrations with your source systems: ERP, CRM, MES and Excel
- Role-based access, from boardroom to shop floor
Our approach
How we automate your management reporting
first
Decide what you steer on & unlock the sources
Which decisions should the dashboard support, and for whom? Five KPIs you act on beat fifty nobody looks at.
We connect your systems, align definitions and build the data layer. Polluted or duplicate data surfaces here - and we fix it before anything reaches a screen.
then
First dashboard live
We start small, with real users and real numbers. What they do with it determines what gets added next.
ongoing
Extend and monitor
New sources and KPIs are added in small steps. Meanwhile we monitor the data flows, so you can trust that the numbers are right.
In practice

Coty
Factory performance worldwide, clearly side by side
What started at one manufacturer grew into a product that is still being developed at Coty ten years later.
View case →
Metics
From Excel sheets to one platform you can trust
Balance sheet, forecasts and scenarios now sit in one place - traceable, shareable and without manual formulas.
View case →The Manufacturing in your pocket platform now runs at two global brands - JDE and Coty. And after five years of working together, Metics no longer steers on dozens of spreadsheets but on one reliable planning platform.

Rather get straight to it? Jasper Kums, partner at Eenvoud, will happily think along with you about the figures you want to steer on. Or start with an Integration scan - a view of your data flows in one week.
Frequently asked questions
What you want to know before you start.
What does it cost to have a dashboard built?
That depends on the number of sources and on how much work the underlying data needs. We work scope-first: together we decide what you want to see and where the data comes from, and after that you get a concrete estimate. We build in small, budget-driven steps, so you can adjust or stop after every step. The Integration scan has a fixed timeline of one week and shows you the scale up front.
Isn’t Power BI or Looker enough?
Sometimes it is. If your data is already clean and in one place and you mainly need standard reports, a BI package is often the shortest route - and we will simply say so. Custom pays off when your sources are scattered, when business logic lives in the numbers, or when the dashboard is part of the daily work process, such as real-time steering on the shop floor.
What if our data is scattered or polluted?
Then you are in good company: that is the real work in almost every project. We unlock the sources, align definitions and build a data layer in which every figure can be traced back to its source. Pollution that surfaces we resolve in a structured way - sometimes a data migration is the first step. We deliberately do not build a dashboard on polluted data: you would be steering in the wrong direction with full confidence.
How current is “real-time”?
As current as your sources and your decisions require. For steering a production line that means refreshing every minute; for a management report, daily is often enough. We set the refresh rate per KPI - refreshing more often than needed makes a dashboard more expensive, not better.
Who maintains the dashboard after delivery?
We agree that up front. Usually we keep watching the data layer and the integrations - with logging and alerts when a source falters - while you manage reports and users yourself. The team that builds also maintains; you never have to explain the system to a service desk that does not know it. Further development happens in the same small steps as the build.
Which technology fits your dashboard?
We choose the technology by what the dashboard needs to do. Reports on top of your existing data are set up in Power BI, as with Taskmaster. When the dashboard is a product in its own right, we develop it in Vue.js with D3.js charts; that is how we built Metics’ scenario planner and the realtime factory dashboard Manufacturing in your pocket. Heavy calculations can run in the browser with WASM, so large datasets still respond directly. Data lives in MySQL or on Azure.